CDC Reports Rising Flu Activity in Its November 6 Update
The CDC says flu activity is increasing in many parts of the U.S. Its November 6 update covers the week ending October 31.
Seasonal flu activity is increasing in many parts of the United States and is higher than typically seen at this point in the year, the CDC said in its November 6 FluView update. The report covers the week ending October 31. Clinical laboratories reported 4,696 positive influenza specimens out of 51,351 tested, a positivity rate of 9.1%.
The report brings together several measures of flu activity. Laboratory tests show which viruses are being detected, while health care visits and hospital data help show the effect on patients. The measures cover different groups of people and should be read with their own labels and reporting periods.
The dates also matter as families look ahead to holiday gatherings. This update describes reported activity through the end of October. It is a national surveillance report, with regional information available through the CDC’s interactive tools.
What the latest flu report shows
Influenza A accounted for 98.6% of the positive clinical laboratory specimens in the weekly table. Public health laboratories most frequently reported the A(H1N1)pdm09 subtype. Clinical and public health laboratories serve different purposes in the surveillance system, so their sample totals and percentages are presented separately.
On the outpatient side, 2.8% of visits to participating providers were for respiratory illness, below the national baseline. The CDC also reported 8,396 patients admitted to hospitals with influenza during the week. The test percentage, visit percentage and admission count each describe a different measure, rather than different estimates of the same total.
How to read a positive-test percentage
The CDC says clinical laboratories generally test specimens for diagnostic purposes. Their results help monitor the timing and intensity of flu activity. A percentage calculated from those specimens describes the submitted tests. It does not measure the share of every U.S. resident who has influenza.
Public health laboratories contribute information about the kinds of viruses circulating and how they are changing. The broader surveillance system combines reports from laboratories, providers, hospitals and health departments. This gives the CDC several ways to follow a season as it develops.
Weekly surveillance figures are preliminary and may change as additional reports arrive. A comparison between weeks is most useful when it uses the same indicator, such as clinical laboratory positivity, rather than switching from a test percentage to a count of hospital patients.
Where to find age and local context
The CDC’s respiratory illness data pages let readers compare emergency department visits and hospitalizations across age groups and select the virus of interest. Those displays can help explain why a single national number may look different from what a family is seeing in its own community or among people of a particular age.
For more detail about influenza in a particular area, FluView links to regional and state data. Look at the reporting date and the key beside each chart. A chart of emergency visits and one of hospital admissions may use different denominators, even when both show a percentage.
People making decisions about symptoms or individual care can bring those questions to a health care professional. The weekly surveillance report describes population trends and does not identify the cause of an individual person’s illness.
This article is for general information and is not medical advice.
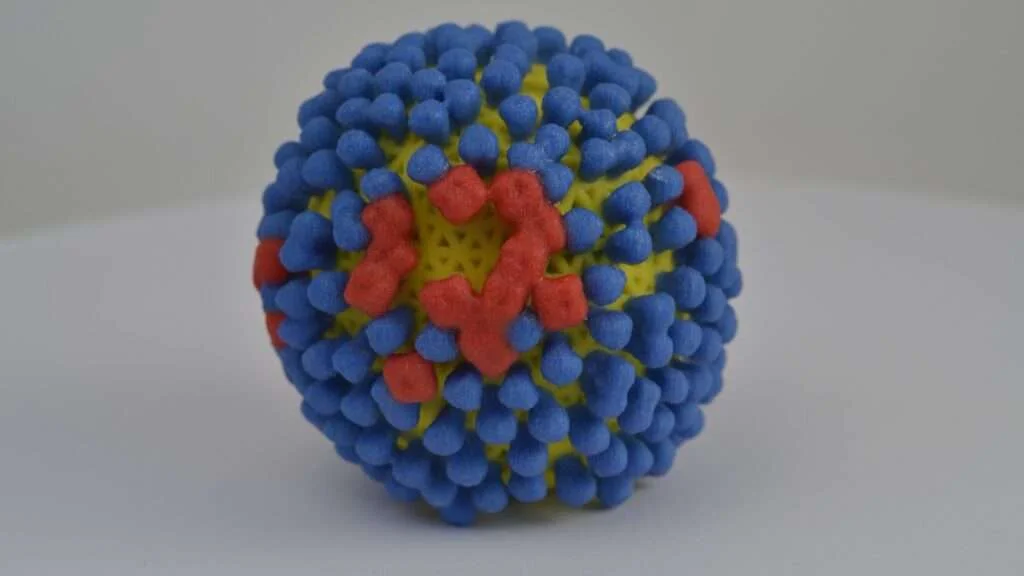
Illustrative photograph of a 3D model. Photo credit: NIAID / NIH via Wikimedia Commons, CC BY 2.0. Cropped.